

This post is a guest blog by Charlie Joey Hadley, the instructor of the SAGE Campus Interactive Visualization with R online course that teaches the techniques and tools for presenting data in visually attractive and interactive ways in the R programming language. Charlie is a Research Technology Specialist at the University of Oxford specializing in data visualization.
Does this R workflow sound familiar to you?
Many, many Excel data files. Tens of R scripts with a slightly different version of the setwd("my-computer/long/file paths/to my/data") at the very top. PowerPoint presentations, PowerPoint posters and Word report – all in different folders. Endless copying and pasting. Tens of copies of the same chart with slightly different but very elaborate filenames… duplicated across multiple folders.
Thankfully, there’s an easier (and more reproducible) workflow. There are two things I’d like to introduce you to in this article:
Always – every single time you write R code – use RStudio Projects
Try using RMarkdown to write your presentations, reports and posters (and your own data blog!)
setwd() and RStudio Projects
RStudio Projects are designed to replace the very bad idea of using setwd() in your R scripts. I’ve included a screenshot of Jenny Bryan’s slides that exaggerates this point to an extreme.
Why is setwd() so bad?
RStudio Projects are designed to replace the very bad idea of using setwd() in your R scripts. I’ve included a screenshot of Jenny Bryan’s slides that exaggerates this point to an extreme.
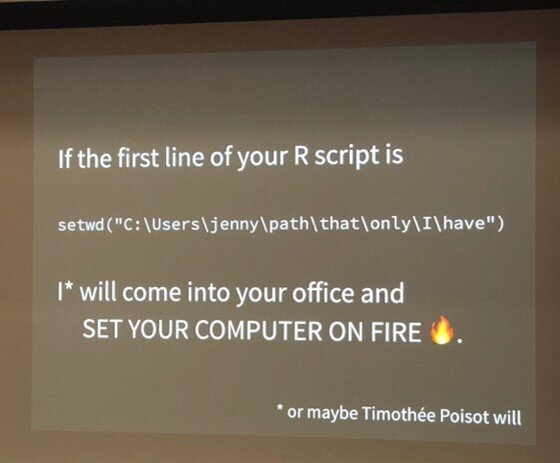
Image from Twitter.
An RStudio Project is a folder on your machine that contains a file with the extension .Rproj. That’s it. It’s good practice to name it after the folder it’s in, eg. ground-breaking-analysis.Rproj. Here are the benefits to your workflow you’ve just unlocked:
Technical benefit: All file paths are relative to the RStudio Project directory.
Workflow benefit: Move the data files (Excel, CSV etc) into a subfolder called "data". Now you can import your data with this kind of path:
survey_model <- read_sas("data/spss_modelling.sas”)survey_data <- read_excel("data/survey-data.xlsx”)
Technical benefit: All your code is now self-contained.
Workflow benefit: Zip up the folder. Email it to a colleague. Tell them to unzip it and then double-click on the ground-breaking-analysis.Rproj file. That’s it. Your code can now be run by your collaborator.
Technical benefit: Your code is prepared for use with version control tools like GitHub.
Workflow benefit: If you want all your work to be reproducible – including your code – the best choice you can make is to use a version control tool. GitHub is the most popular option, and the one I use. Now your code is in RStudio Projects you’re setup to follow this excellent guide - happygitwithr.com
So, how do we create RStudio Projects?
In the top-right hand corner of RStudio there’s a little menu that will read “Project: (None)” if you’ve never used projects before. Here’s what you need to convert an existing folder into a project:
Project: (None) > New Project… > Existing Directory > Browse… (to your folder) > Create ProjectThat’s everything you need to do. Here are a few pointers for going further:
File names matter. Start using standardized filenames by following Jenny Bryan’s excellent slide deck.
The {usethis} package contains lots of useful tools for standardizing your projects and simplifying common tasks.
RMarkdown for every part of your workflow
Your research might have started with a question or a hypothesis but the heart of your work is the data. When you’ve collected (or discovered) your data the very first thing you’ll want to do is explore and understand it. In stats and data science circles we like to call that exploratory data analysis (EDA).
It’s fairly hard to do good EDA in R scripts because code comments just don’t work for writing about what you’re doing. I highly recommend that you consider using RMarkdown for this part of your workflow every time you get new data or a new idea.
A RMarkdown document is like a script file, but different. It’s got the file extension .Rmd and it allows us to include all of these things together; headings, paragraphs of text, code, charts, tables and interactive data visualisations. One big difference between an .Rmd file and a script file is we write our .Rmd file and then we output a document from that – which we call knitting.
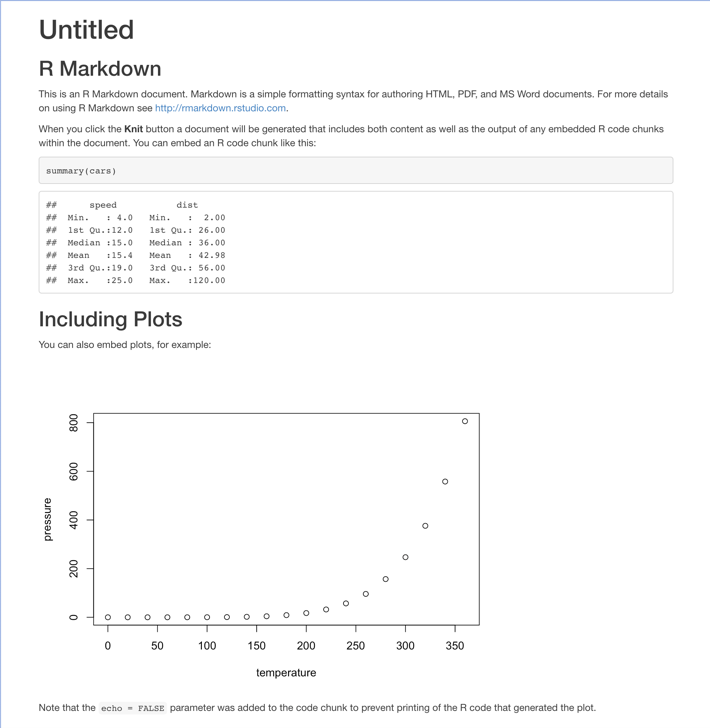
I’ve included a screenshot of the knitted RMarkdown document that you can create by following these two steps in RStudio:
File > New File > R Markdown... > OKFind and click the “🧶 Knit” button at the top of the file
It’s a very basic document, but hopefully you can appreciate how it combines multiple types of content together. This makes it a great EDA tool because you can start to write stories about your data as you’re discovering (and testing) them. That might be as much as you ever do with RMarkdown. Still, I think it will forge a closer relationship between your data, code and research outputs.
But RMarkdown is designed for generating reports and presentations - in a wide variety of different formats. I’ll summarize the benefits of some of the formats available to you below:
RMarkdown output type: Academic articles, including PhD theses (PDF)
Benefits to using RMarkdown instead of your current default software: In academia our principal communication method is long reports/theses published in PDF documents. Usually, these documents are written in MS Word. This separates your written word from both the data and code that you used to develop your research stories and hypotheses.
Imagine writing this sentence in MS Word: “In study A there were 890 respondents, 80% completed the survey”
What if it turned out that you’d miscoded data, and actually only 70% of respondents completed the survey. How could you be sure all these inline values are up to date with your code? Using RMarkdown to write your reports allows all values (charts, tables and everything else) to be up to date - because they’re generated directly from the data and the code.
RMarkdown output type: PowerPoint slide decks
Benefits to using RMarkdown instead of your current default software: Most folks I know who use R and write their presentations separately in PowerPoint have a copy pasting issue. It’s extremely hard to remember which bit of code made exactly which chart. By using RMarkdown to knit together our PowerPoint slides we’ll always be able to trace the exact path from our data to each individual chart in our presentation.
RMarkdown output type: Interactive HTML web pages
Benefits to using RMarkdown instead of your current default software: RMarkdown allows us to create interactive webpages without learning anything about web development or other software. There are many R packages for creating interactive maps, charts and more – these can all be used inside your RMarkdown reports. For an overview of what kind of interactive things you can build see htmlwidgets.org.
RMarkdown output type: Data blogs
Benefits to using RMarkdown instead of your current default software: By combining RMarkdown with the {blogdown} package it’s possible to build a fully featured data blog all inside of RStudio – without any web development experience.
Where to learn more
If you’re interested in learning about how RMarkdown is used in the wild, I’d recommend reading how Sharla Gelfand uses the tool for reporting at the College of Nurses in Ontario.
In my Interactive Data Visualization with R online course I introduce an end-to-end workflow for telling data stories with RMarkdown and the tidyverse. I’d recommend it for anyone who wants to learn the practical steps to getting data into R and communicating it to readers with RMarkdown.
If you’re interested in SAGE Campus as a resource for your institution, find out how libraries can subscribe to get institution-wide access to all our online courses and how faculty can create cohorts and assign students or researchers courses.