

This post is a guest blog by Charlie Joey Hadley, the instructor of the SAGE Campus Interactive Visualization with R online course that teaches the techniques and tools for presenting data in visually attractive and interactive ways in the R programming language. Charlie is a Research Technology Specialist at the University of Oxford specializing in data visualization.
It’s wonderful to see how widely social science departments are embracing the teaching of R to students at all levels, from Bachelor’s to dedicated doctoral training centers. R provides students with a vast (and ever growing) collection of packages for any and all types of analysis, modelling and data visualization that they might come across in their future careers… whether in industry, academia or government. It’s very clear that R is growing in popularity and enterprise-level application in all 3 of these sectors, mostly thanks to R being free and open-source.
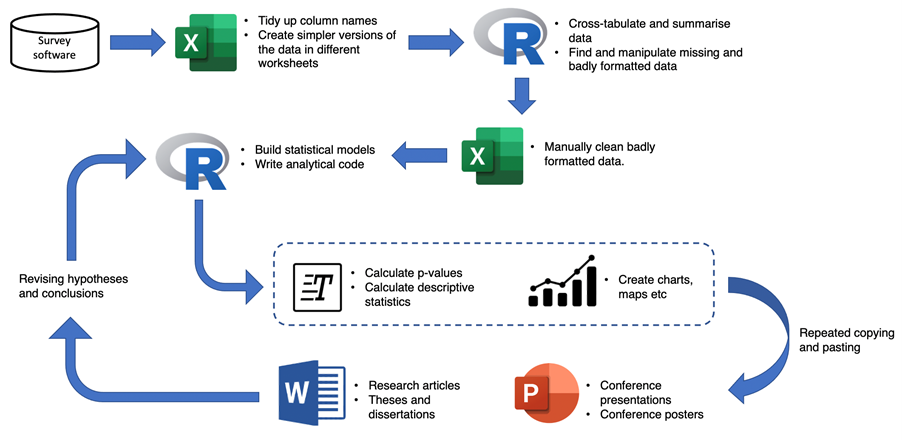
However, in a lot of teaching R is framed as a small part of the workflow for writing and telling data-driven stories. This often leads to a bit of a disjointed workflow that I’ve mocked up in the image below.
I’ve previously written for SAGE Campus about how combining R and RMarkdown benefits students and researchers, but here I’d like to focus on the benefits for you as instructors and course leads.
Do students manipulate data in Excel or R?
Code is the gold standard for reproducible data analysis (and visualisation). Excel does not encourage good data practices, here are a few examples of why:
Individual cells can be manipulated at will without a casual reader noticing
The very useful “text to columns” wizard does not keep a history of how columns were separated
It’s common to accidentally misapply function across columns – sometimes causing country-level austerity cuts.
However, most of your students will have been using Excel for years before you first meet them. I’ve experienced what this leads to many times – most students will try and use Excel for as much of their data wrangling as possible and only use R code where they can’t get something to work in Excel. Over several years these young researchers might become slightly more comfortable with using R for some of the wrangling. Unfortunately, in practice this leads to a big problem. It becomes hard to keep track of which part of the data wrangling was done in R and which was done in Excel.
It’s also going to make it harder for you to evaluate project-based assignments for reproducibility. You (or anyone else you’ve roped into marking) will need to scour through both code and Excel files to ensure correctness. These Frankenstein monster-like workflows aren’t helpful to anyone.
I therefore recommend that you teach your students to use R as soon as possible in their workflows. We’re very fortunate that the most commonly used data formats in the social sciences can be read into R with the following well documented and user-friendly packages:
| File format | R package | |
|---|---|---|
| .csv, .tsv, .txt | readr | |
| xlsx,xls | readxl | |
| SAS formats | haven | |
| SPSS | haven | |
| Map shapefiles | sf |
Encourage students to explain their code as they go
If you’re not really familiar with RMarkdown here’s the quickest description I can give:
RMarkdown lets R users write a report that includes text, code and code outputs – including charts created with plot() and {ggplot2}. It is radically different (and better) than adding comments to R scripts.
This makes RMarkdown a very good tool for you to test your students understanding of how raw data needs to be cleaned, tidied and normalized before it can be analyzed and interpreted. I’d recommended considering constructing a project-based course using this template:
Students are provided raw data from a survey (course-101-survey.xlsx) and required to submit two reports during the semester:
Initial data report (20%)
Students must submit a complete RStudio project, including the following files; your-project.Rproj, report.Rmd, report.pdf and data-raw/course-101-survey.xlsx
When writing your report please consider the following:
You are being assessed on your understanding of the data quality issues and how they can be mitigated.
You do not need to construct or test hypotheses in this report.
You are encouraged to use charts that show/highlight issues in the datasets.
Survey report (80%)
Students must submit a complete RStudio project, including the following files; your-project.Rproj, report.Rmd, report.pdf and data-raw/course-101-survey.xlsxWhen writing your report please consider the following:
You are being assessed on your ability to identify meaningful conclusions from the survey data and how well they are communicated to your reader.
You must make use of statistical measures or other techniques to justify your conclusions. All figures and numbers included within sentences must be generated from R code.
You are encouraged to use charts in your report.
Freedom for students to choose datasets
I’d recommend that you experiment with giving students the opportunity to find their own raw datasets for these reports. This does often create more work for you as the instructor – particularly the first time you try it. However, there are a few advantages I’d like to highlight:
If your course is being sat by students from multiple degree programmes, it can be difficult to find a single dataset that’s going to be interesting/relevant to everyone.
If you use the same dataset every year it is difficult to provide sample reports to students that won’t lead to plagiarism-related issues.
As an instructor it’s very difficult to remain interested in marking the exact same analysis year in and year out.
Encouraging students to experiment with different datasets will increase their range of experience and is more likely to result in students wanting to use R in the future.
It would be quite difficult to give your students this level of flexibility if you did allow them to perform data wrangling tasks within Excel. By using R and RMarkdown together you can give your students a somewhat realistic experience of how real-world data stories are written.
If you’re still reading you’re likely going to ask – “where can students find good datasets?!”. Here are a few suggestions:
TidyTuesday. Every week a new dataset is added to the TidyTuesday github and the R community is invited to show what they can do with it.
Kaggle Datasets. There are over 63k datasets available, including many industry-standard used in text mining, social network analysis and other fields.
Country-specific statistics and census offices.
I’d also recommend that you organize a seminar/workshop for students to discuss their dataset choices before the first report is due. This can help students who are struggling and provide you an opportunity to nudge students who have chosen datasets that are too small or simple for your course.
What happened to MS Word and PowerPoint?
It is an inescapable fact that many academic publishers (and other places) rely almost exclusively on MS Word documents, and not the PDF that I recommended you assess your students with. But that’s okay, because RMarkdown will happily export Word documents.
You might also want to incorporate an oral presentation into your project work, thankfully it’s also possible to export PowerPoint slides from RMarkdown.
This sounds like a lot to teach
My SAGE Campus course on Interactive Visualization with R teaches all of the skills and workflows that you and your students will need to write reports with RMarkdown. Incorporating this online course to your project-based course will allow you to focus on teaching your students the subtleties of data wrangling, cleaning and how to tell data-driven stories.