This post is a guest blog by Andy Kirk, the instructor on our Introduction to Data Visualisation course that teaches how to master the principles for transforming data into powerful visualisations. Andy is a UK-based data visualisation specialist and a visiting lecturer teaching data visualisation on a Master's degree programme at Imperial College London. Since founding Visualising Data Ltd in 2011, Andy has delivered over 230 public and private training workshop events in 19 countries.
Exploratory data analysis
So much attention in data visualisation focuses on its role as a means of communicating data to others. However, this only represents one side of the coin. The other key role of visualisation is to help us, as analysts, explore our data. Visuals help supplement statistical analysis, offering techniques that can help us thoroughly interrogate data to unearth insights and qualities that may otherwise be hidden from view.

In this article, I want to look at the ways of organising the thinking involved when you undertake Exploratory Data Analysis (commonly abbreviated to EDA). This article is adapted from a section in my book, ‘Data Visualisation: A Handbook for Data Driven Design’, published by SAGE.
At a news briefing in February 2002, the US Secretary of Defense, Donald Rumsfeld, delivered his infamous ‘known knowns’ statement:
Reports that say that something hasn’t happened are always interesting to me, because as we know, there are known knowns; there are things we know we know. We also know there are known unknowns; that is to say we know there are some things we do not know. But there are also unknown unknowns – the ones we don’t know we don’t know. And if one looks throughout the history of our country and other free countries, it is the latter category that tend to be the difficult ones.
There was widespread ridicule about the apparent lack of elegance in the language used and criticism of the muddled meaning, but I found myself disagreeing with this view. I actually thought it was probably the most efficient way he could have articulated the complex nature of what he was explaining.
visual exploration
The essence of Rumsfeld’s statement was to distinguish awareness of what is knowable about a subject (what knowledge exists) from the acquiring this knowledge. It is quite helpful to consider using this structure to shape one’s approach to thinking about visual exploration.
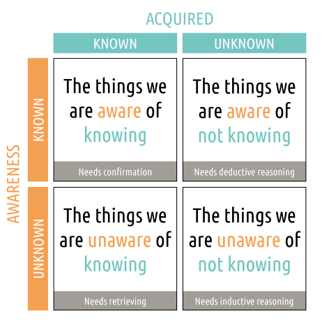
The known knowns are aspects of knowledge about a subject and about the qualities present in its data that you are aware of knowing about. You will often have good instincts and preconceived notions of what might be the most interesting and relevant views of your data to investigate.
Though it is, of course, good to know things and helpful to have a sense of what to look for in advance, in exploratory data analysis it can be slightly limiting. You can become complacent by just concentrating on the potentially narrow viewpoints of known knowns. It may offer a reasonably sound heuristic but, ideally, you must seek to give yourself as broad a view as possible across the entirety of the subject as represented by its data. This will help to optimise your chance to discover other relevant but maybe unexpected findings.
Occasionally (but probably rarely) there may be unknown knowns, things you did not realise you knew or perhaps did not wish to acknowledge that you knew about a subject. This may relate to previous understandings that have been forgotten or possibly consciously ignored. Regardless, you need to reacquaint yourself with them and consider their relevance to your broader goals.
The known unknowns and the even more elusive unknown unknowns require tactics to help you efficiently plug these gaps as far, as deep and as wide as possible. You cannot possibly achieve mastery of all the subject domains you work with. Instead, you need to have the capacity and capability to turn as many unknowns as possible into knowns. In doing so, this will optimise your understanding of a subject. Only then will you be capable of appreciating the full array of viewpoints the data offers. However, as mathematician John Tukey once described:
“‘Exploratory data analysis is an attitude, a flexibility, and a reliance on display, not a bundle of techniques.’”
There is no single path to undertaking this activity effectively; it requires a number of different technical, practical, and conceptual capabilities.
The instinct of the analyst
The attitude and flexibility that Tukey describes are about recognising the importance of the traits of the analyst. Effective EDA is not about the tool. There are many vendors out there pitching their devices as the magic ‘point and click’ option that will uncover deep discoveries. Technology inevitably plays a key role in facilitating this endeavour, but you cannot underestimate the value of a good analyst: it is arguably more influential than the differentiating characteristics between one tool and the next.
In the absence of a defined procedure for conducting EDA, the analyst needs to possess a capacity to recognise and pursue a scent of enquiry. A good analyst will have that special blend of natural inquisitiveness and the sense to know what approaches (statistical or visual) to employ and when. Furthermore, when these traits collide with a strong subject knowledge this means better judgments are made about which findings from the analysis are meaningful and which are not.
Reasoning
As I have mentioned, efficiency is a particularly important aspect of this exploration activity. The act of interrogating data, waiting for it to volunteer its secrets, can take a lot of time and energy. Even with smaller datasets, you can find yourself tempted into trying out myriad combinations of different analyses, driven by the desire to find the killer insight lurking away in the shadows.
Reasoning is an attempt to help reduce the size of this challenge. Even in relatively small datasets you cannot expect nor afford to try pursuing all potential avenues of enquiry. With so many statistical and visual methods available to analysts, unleashing the full exploratory artillery is rarely feasible. EDA is about being smart, recognising that you need to be discerning about your tactics. In academia there are two distinctions in approaches to reasoning – deductive and inductive – that I feel are usefully applied in this discussion:
Deductive reasoning is targeted: You have a specific curiosity or hypothesis, framed by subject knowledge, and you are going to interrogate the data in order to determine whether there is any evidence of relevance or interest in the concluding finding. I consider this adopting a detective’s mindset (Sherlock Holmes). This will assist in confirming your known knowns as well as investigating your known unknowns. Sometimes the consequence of this reasoning is not to obtain answers but to have a better understanding of the key questions.
Inductive reasoning is much more open in nature: You will ‘play around’ with the data, based initially on a sense about what might be of interest, and then wait and see what emerges. In some ways this is like prospecting, hoping for that moment of serendipity when you unearth gold. You will maintain an open mind, letting the flow of discovery take you down potentially unexpected permutations. This is the activity that will most likely lead your attempt to tackle the more slippery unknown knowns and unknown unknowns. It is important to give yourself room to embark on these somewhat less structured exploratory journeys.
I tend to think about EDA by comparing it to the challenge of solving a ‘Where’s Wally?’ visual puzzle. The process of finding Wally feels random. You tend to begin by letting your eyes race around the scene like a dog who has just been let out of the car and is torpedoing across a field. After the initial burst of randomness, perhaps subconsciously, you then go through a more considered process of visual analysis. Elimination takes place by working around different parts of the scene and sequentially declaring ‘Wally-free’ zones. This aids your focus and strategy for where to look next. As you then move across each mini-scene you are pattern-matching, seeking the giveaway characteristics of the boy wearing glasses, a red-and-white-striped hat and jumper, and blue trousers.
The objective of this task is clear and singular in definition. The challenge of EDA is rarely that clean. There will always be a source of curiosity to follow and you might find evidence of the ‘Wally’ somewhere in your data. However, unlike the ‘Where’s Wally?’ challenge, in EDA you have the chance also to find other answers. Things that might alter the scope of what qualifies as interesting and relevant. In unearthing other discoveries, you might determine that you no longer care about Wally; finding him no longer represents the main enquiry.

Chart types
This is about seeing data from all available visual angles. The power of visual perception means that we can easily rely on our pattern-matching and sense-making capabilities – in harmony with contextual subject knowledge – to make observations about our data. Through visualising your data for yourself you are able to establish a greater acquaintance with the characteristics of your data’s values: its magnitude, distribution, relationships, and exceptions.
Visualisations help you move beyond looking at data towards starting to see it. You discover what is in your data but also, crucially, what is NOT in there. Every chart type offers a different view of your data and facilitates specific observations. You need to learn the capabilities and limitations of each chart type to understand how and when to deploy them. You also need to develop your charting vocabulary by embracing a larger range of options, not limiting yourself to the narrow set of tried and trusted approaches. As with your statistical literacy, broadening your visual literacy will widen the potential view of your data.
Subject knowledge
Conducting exploratory analysis without the requisite subject domain knowledge leaves you exposed: you may not know if what you are seeing is meaningful, significant, or unexpected. The approach to bolstering your knowledge of a subject is largely common sense: you explore the places (books, websites) and consult the people (experts, colleagues) that will collectively give you the best chance of asking the right questions of your data and knowing how to interpret the answers you get back.
Nothing to see here?
What if you have found nothing? You have hit a dead end. Despite trying out all conceivable angles of attack, you have discovered no significance in any relationships and have fundamentally found nothing ‘interesting’ about the patterns and shape of your data. What do you do? In these situations, you need to adopt the attitude that nothing is usually something. Going down blind alleys and hitting dead ends can be useful. The ‘nothing to see hear’ discovery can help you develop focus by eliminating dimensions of possible analysis, as I illustrated with the ‘Where’s Wally’ example. If you have attributes of nothingness in your data – gaps, nulls, zeroes – you might find that these could prove to be the critical insight.
“There is always something interesting in your data. If a value has not changed over time, maybe it was supposed to – that is an insight.”
If everything is the same size, that is the story. If there is no significance in the quantities, categories, or spatial relationships, make those your insights. You will only know that these findings are relevant by truly understanding the context of the subject matter. This is why you must make as much effort as possible to convert as many of your unknowns into knowns.
Faculty can assign our online courses to their students and researchers to equip them with the knowledge they need. Find out about our Introduction to Data Visualisation course and sign up to our demo hub to try a free module.
Libraries can get a full 30-day institution-wide trial to SAGE Campus. Recommend us to your library or request a trial if you are an administrator via this form.